Elementary School Teacher Salary in California: $100,082 (2026)
Quick Answer:Across California's 158 metropolitan areas, the average median elementary school teacher pay sits at $100,082/year heading into 2026 — a figure projected from 2025 BLS OEWS wage data for SOC 25-2021. Because California sits at BEA RPP 113.1 (13% above the U.S. baseline), that statewide median translates to roughly $88,490 in nationally-comparable purchasing power. Highest-paying metros: Sunnyvale ($105,275), Santa Ana ($105,169), Santa Clara ($104,584).
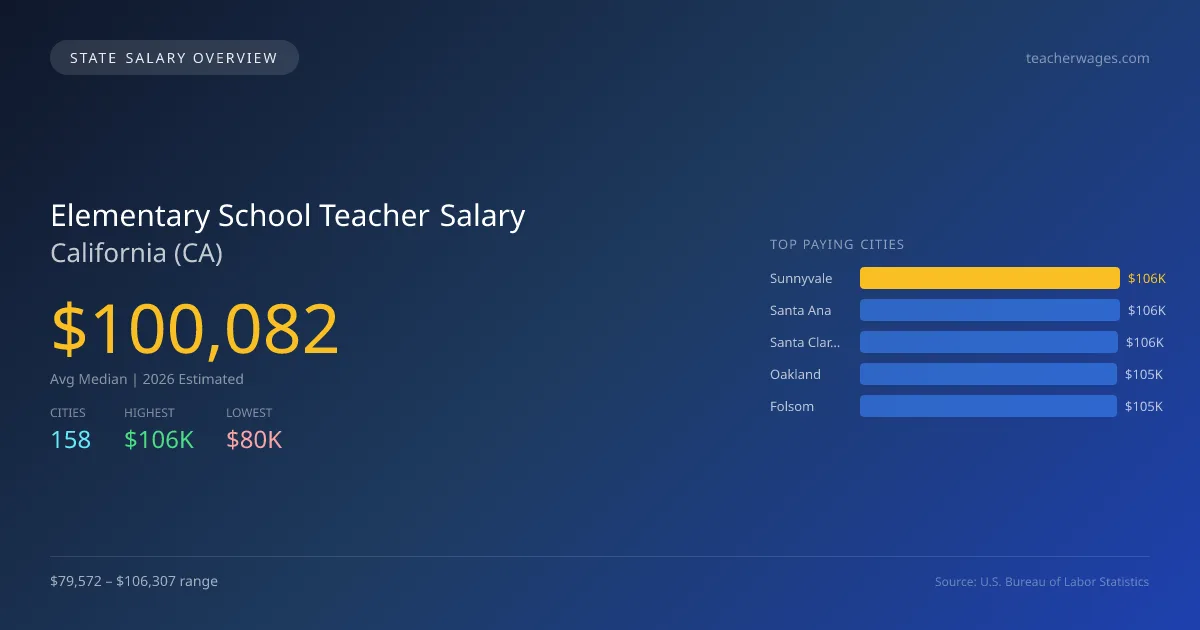
In 2026, the average median salary for elementary school teachers in California is projected to be $100,081, significantly higher than the national median of $64,597, representing a difference of +54.9%. The highest paying city is Sunnyvale at $106,307, while the lowest is Fresno, with a salary of $79,572, creating a salary gap of $26,735 between these two cities. This disparity is primarily driven by the cost of living, local funding for schools, and demand for teachers in specific areas. California has specific state licensing requirements that can influence salaries, including stringent credentialing processes. Additionally, scope of practice laws and high demand for qualified educators in certain metropolitan areas further impact compensation. The projected employment growth rate for elementary school teachers in the state is 0.98%, indicating a stable job market in this sector. The total number of employed elementary school teachers in California stands at 153,159 as of the 2026 projection, with cities like Santa Ana ($106,200), Santa Clara ($105,609), Oakland ($105,199), and Folsom ($105,109) also ranking among the top salary offerings. Overall, prospects for elementary school educators in California are favorable, particularly in urban centers where funding and demand align for higher salaries.
California Elementary School Teacher Salary Range
Overall salary range in California: $60,235 (lowest entry-level) to $164,775 (highest top earner)
California vs National Average
California elementary school teachers earn 54.93% more than the national median (+$35,485/year difference).
California Elementary School Teacher Salary Distribution (2026)
Elementary School Teacher salaries in California range from $63,181 (entry-level, 10th percentile) to $128,532 (top earners, 90th percentile), with a median of $100,082. The California median is $35,485 above the US national median of $64,597. The average hourly rate is $48.12/hr. Approximately 153,159 elementary school teachers are employed across 158 cities.
2019 BLS Actual
$82,499
2025 BLS Actual
$99,110
2026 Current Est.
$100,082
2019–2027 Growth
+22.5%
Salary Trajectory for Elementary School Teachers in California (2019–2027)
2019–2025: actual BLS OEWS data for this metro area. 2026+: CAGR 0.98% projection.
| Year | Annual Salary | Status |
|---|---|---|
| 2019 | $82,499 | Actual |
| 2020 | $85,275 | Actual |
| 2021 | $90,101 | Actual |
| 2022 | $90,804 | Actual |
| 2023 | $95,625 | Actual |
| 2024 | $95,984 | Actual |
| 2025 | $99,110 | Actual |
| 2026(current) | $100,082 | Estimated |
| 2027 | $101,063 | Projected |
Based on 7 years of BLS OEWS data for the California metropolitan area, the median elementary school teacher salary grew 20.1% from $82,499 (2019) to $99,110 (2025). At a 0.98% compound annual growth rate, salaries are projected to reach $101,063 by 2027 — a total increase of $18,564 (22.50%) from 2019.
Note: Historical values (2019–2025) are actual BLS OEWS figures for the California metropolitan area, sourced from annual Occupational Employment and Wage Statistics surveys. 2026–2026 figures are current estimates, and 2027 values are projections, calculated using a 0.98% CAGR derived from 7-year BLS historical data. Actual salaries may vary based on employer, experience, certifications, and local market conditions.
Top 5 Highest Paying Cities in California
Lowest Paying Cities in California
| City | Median Salary |
|---|---|
| Fresno | $79,572 |
| Bakersfield | $80,683 |
| Redding | $84,601 |
| Brea | $95,099 |
| Chico | $95,931 |
Best Value Cities for Elementary School Teachers in California
When adjusted for local cost of living, these California cities offer the most purchasing power for elementary school teachers.
| City | Nominal Salary | CoL Index | Adjusted Salary |
|---|---|---|---|
| El Centro | $101,374 | 95.174 | $106,514 |
| Merced | $101,101 | 98.275 | $102,876 |
| Visalia | $99,395 | 99.825 | $99,569 |
| Modesto | $102,636 | 104.108 | $98,586 |
| Sacramento | $104,403 | 106.67 | $97,875 |
Adjusted salary = nominal salary × (100 / CoL index). CoL index: 100 = national average. Lower index = lower cost of living.
Salary by Experience Level in California
| Experience Level | Estimated Annual |
|---|---|
| Entry Level (0-2 years) | $63,181 |
| Mid Career (3-7 years) | $100,082 |
| Experienced (7+ years) | $128,532 |
Estimates based on BLS percentile data averaged across California metro areas. Individual pay varies by employer, certifications, and specialization.
All 158 Cities in California
| # | City | Median Salary |
|---|---|---|
| 1 | Sunnyvale | $106,307 |
| 2 | Santa Ana | $106,200 |
| 3 | Santa Clara | $105,609 |
| 4 | Oakland | $105,199 |
| 5 | Folsom | $105,109 |
| 6 | Anaheim | $104,689 |
| 7 | Sacramento | $104,403 |
| 8 | Fontana | $104,235 |
| 9 | Irvine | $104,120 |
| 10 | Roseville | $103,973 |
| 11 | San Jose | $103,868 |
| 12 | Pomona | $103,613 |
| 13 | Simi Valley | $103,555 |
| 14 | Escondido | $103,531 |
| 15 | Fairfield | $103,345 |
| 16 | Long Beach | $103,200 |
| 17 | Fullerton | $102,964 |
| 18 | Fremont | $102,878 |
| 19 | Daly City | $102,875 |
| 20 | Los Angeles | $102,858 |
| 21 | San Francisco | $102,858 |
| 22 | El Monte | $102,843 |
| 23 | Vista | $102,786 |
| 24 | Concord | $102,761 |
| 25 | Modesto | $102,636 |
| 26 | Clovis | $102,608 |
| 27 | Garden Grove | $102,503 |
| 28 | Temecula | $102,479 |
| 29 | Santa Clarita | $102,410 |
| 30 | Lancaster | $102,276 |
| 31 | Inglewood | $102,276 |
| 32 | Corona | $102,146 |
| 33 | Richmond | $102,130 |
| 34 | Rialto | $102,082 |
| 35 | Santa Maria | $102,020 |
| 36 | Torrance | $101,951 |
| 37 | Vallejo | $101,778 |
| 38 | Elk Grove | $101,758 |
| 39 | Oceanside | $101,733 |
| 40 | Whittier | $101,703 |
| 41 | San Rafael | $101,695 |
| 42 | Rancho Cucamonga | $101,604 |
| 43 | Hayward | $101,546 |
| 44 | Woodland | $101,520 |
| 45 | Buena Park | $101,505 |
| 46 | Encinitas | $101,497 |
| 47 | Downey | $101,490 |
| 48 | Dublin | $101,433 |
| 49 | Redlands | $101,401 |
| 50 | Napa | $101,394 |
| 51 | El Centro | $101,374 |
| 52 | Chino | $101,346 |
| 53 | Westminster | $101,314 |
| 54 | Santa Monica | $101,306 |
| 55 | San Mateo | $101,296 |
| 56 | Tulare | $101,267 |
| 57 | San Buenaventura | $101,231 |
| 58 | Salinas | $101,202 |
| 59 | Mission Viejo | $101,164 |
| 60 | Moreno Valley | $101,163 |
| 61 | Pleasanton | $101,148 |
| 62 | Merced | $101,101 |
| 63 | Pasadena | $101,004 |
| 64 | Santee | $100,934 |
| 65 | Glendale | $100,843 |
| 66 | Ontario | $100,827 |
| 67 | Mountain View | $100,790 |
| 68 | Pittsburg | $100,782 |
| 69 | Novato | $100,751 |
| 70 | Costa Mesa | $100,712 |
| 71 | Berkeley | $100,607 |
| 72 | Huntington Beach | $100,583 |
| 73 | Jurupa Valley | $100,494 |
| 74 | Hemet | $100,465 |
| 75 | Union City | $100,457 |
| 76 | West Covina | $100,446 |
| 77 | Chino Hills | $100,418 |
| 78 | Oxnard | $100,394 |
| 79 | Gilroy | $100,274 |
| 80 | Santa Cruz | $100,233 |
| 81 | San Marcos | $100,219 |
| 82 | Tustin | $100,132 |
| 83 | San Ramon | $100,124 |
| 84 | Santa Rosa | $100,031 |
| 85 | Eastvale | $100,028 |
| 86 | Murrieta | $100,025 |
| 87 | Vacaville | $100,025 |
| 88 | Thousand Oaks | $99,988 |
| 89 | Brentwood | $99,980 |
| 90 | Hesperia | $99,933 |
| 91 | Lake Elsinore | $99,925 |
| 92 | Citrus Heights | $99,798 |
| 93 | El Cajon | $99,709 |
| 94 | San Clemente | $99,679 |
| 95 | Bellflower | $99,639 |
| 96 | San Bernardino | $99,609 |
| 97 | Palmdale | $99,596 |
| 98 | La Mirada | $99,595 |
| 99 | Apple Valley | $99,575 |
| 100 | Menifee | $99,546 |
| 101 | Yucaipa | $99,505 |
| 102 | Norwalk | $99,498 |
| 103 | Riverside | $99,485 |
| 104 | Hanford | $99,435 |
| 105 | Rancho Cordova | $99,409 |
| 106 | Visalia | $99,395 |
| 107 | Montebello | $99,314 |
| 108 | Compton | $99,274 |
| 109 | Porterville | $99,203 |
| 110 | Lompoc | $99,190 |
| 111 | Petaluma | $99,075 |
| 112 | Hawthorne | $99,036 |
| 113 | Antioch | $99,004 |
| 114 | Burbank | $98,996 |
| 115 | Alhambra | $98,767 |
| 116 | Livermore | $98,767 |
| 117 | Orange | $98,736 |
| 118 | South Gate | $98,734 |
| 119 | Victorville | $98,712 |
| 120 | West Sacramento | $98,679 |
| 121 | Poway | $98,653 |
| 122 | San Luis Obispo | $98,577 |
| 123 | San Leandro | $98,520 |
| 124 | Indio | $98,409 |
| 125 | Lake Forest | $98,409 |
| 126 | Stockton | $98,355 |
| 127 | Carson | $98,234 |
| 128 | Rocklin | $98,218 |
| 129 | Chula Vista | $98,065 |
| 130 | Newport Beach | $98,052 |
| 131 | Redwood City | $98,044 |
| 132 | Turlock | $98,020 |
| 133 | Manteca | $97,988 |
| 134 | Perris | $97,980 |
| 135 | San Diego | $97,951 |
| 136 | Yuba City | $97,951 |
| 137 | Madera | $97,901 |
| 138 | Baldwin Park | $97,726 |
| 139 | Palo Alto | $97,726 |
| 140 | Lakewood | $97,686 |
| 141 | Beaumont | $97,400 |
| 142 | Tracy | $97,377 |
| 143 | Alameda | $97,345 |
| 144 | Laguna Niguel | $97,321 |
| 145 | Milpitas | $97,274 |
| 146 | Carlsbad | $97,132 |
| 147 | Camarillo | $97,067 |
| 148 | Oakley | $97,028 |
| 149 | Davis | $97,003 |
| 150 | Lodi | $96,997 |
| 151 | Upland | $96,933 |
| 152 | La Habra | $96,789 |
| 153 | Lynwood | $96,750 |
| 154 | Chico | $95,931 |
| 155 | Brea | $95,099 |
| 156 | Redding | $84,601 |
| 157 | Bakersfield | $80,683 |
| 158 | Fresno | $79,572 |
More California Salary Data
Hourly Rates
Explore elementary school teacher hourly pay in California cities.
Senior / Experienced
Top earner salaries for experienced elementary school teachers.
Compare Cities in California
View all comparisons →Explore More Elementary School Teacher Salary Data
Frequently Asked Questions
How much do elementary school teachers make in California in 2026?
What is the highest paying city for elementary school teachers in California?
How does California elementary school teacher pay compare to the national average?
What is the entry-level elementary school teacher salary in California?
How many elementary school teachers are employed in California?
Which California city offers the best value for elementary school teachers?
Written by Jordan Lee, M.Ed.
Career Analyst
Jordan Lee has over 10 years of experience in elementary education. They focus on curriculum development and teaching methodologies. Their experience includes working in public schools.
Methodology & Data Source
Statewide salary figures on this page are 2026 projections based on the Bureau of Labor Statistics Occupational Employment and Wage Statistics (OEWS) survey, May 2026 release. A 0.98% compound annual growth rate (CAGR), derived from 6-year national BLS wage trends, was applied to each metro area's reported salary to estimate current 2026 elementary school teacher compensation across California. State averages are employment-weighted across 158 metro areas — larger metro areas with more elementary school teacherscontribute proportionally more to the average, producing figures that better reflect typical compensation. Individual pay varies by city, employer, certifications, and experience.
Data Sources & Methodology
Source: BLS, OEWS, 7-year dataset (–). Per-city data from annual BLS metropolitan area surveys.
2026 figures are projected from 2025 BLS data using a compound annual growth rate (CAGR) of 0.98%, derived from historical BLS wage trends for elementary school teachers (SOC 25-2021).
Compiled and verified by Jordan Lee, M.Ed., a licensed elementary school teacher with 10+ years of clinical experience. · View source data at BLS.gov